“So now that we have a weather station at the clubhouse, why aren’t we broadcasting real-time weather thru APRS?” said John Zaruba K2ZA one day, signaling the start of another GCARC Skunkworks project. The weather station (a topic for another article) was up and running and its output could be viewed from a web server on the clubhouse network, but without a VPN connection to the clubhouse (or being physically present there) nobody could see it. And the clubhouse weather was getting increasingly important with the upcoming heat of summer since we wanted to monitor the temperature inside the satellite room because several computers are running 24/7 there. In addition, several of us are working with the Cooper Health System emergency communications team and planning to use APRS as a means to report from remote healthcare facilities, so it made sense for us to get familiar with creating customized APRS messages and figuring out how to transmit and monitor them over the air.
Hardware
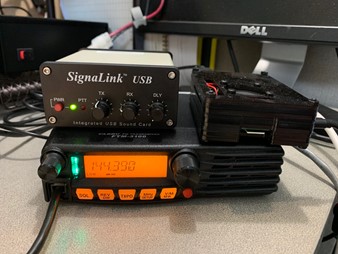
The APRS station would require three pieces of hardware – a 2-meter FM radio, a Raspberry Pi computer and a USB audio device to transfer the sound from the Pi to the radio. I had hoped that we could reuse one of two vintage 2 meter FM radios (an IC-28H or an IC-27) that I had left over from the packet radio era in the 1980s, but the IC-28 started giving off a burning-component smell when powered up and the IC-27 didn’t appear to have any audio output so we had to pick up a FTM-3100 from HRO to get started. I connected it to a 2 meter vertical that had been taking space in my garage for about 15 years and set it up temporarily on the clubhouse “antenna testbed” (formerly known as a “picnic table”) until we can mount it on the mast at the west end of the clubhouse.
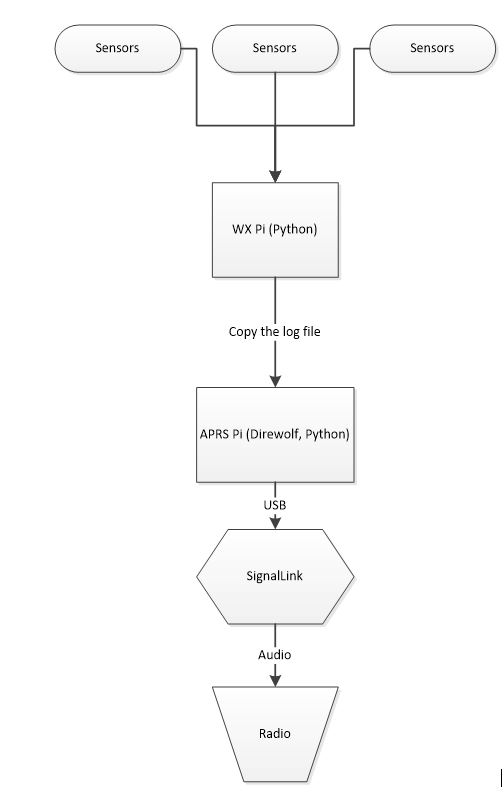
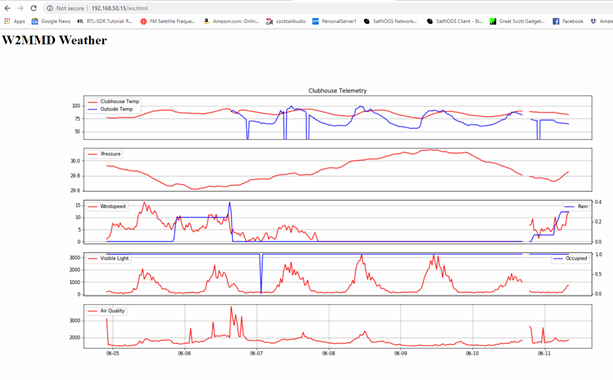
The weather computer runs on its own Raspberry Pi, which is mounted on an acetate plate with all of the sensors and other components on the south wall of the satellite room. It samples the sensors every minute and writes the values to a log file. That log file is summarized by another Python program to develop the graphs below. (At some future point we hope to link those graphs to the GCARC website.) For APRS we elected to use that file and reformat it into the APRS beacon format.
The APRS function runs in Direwolf on another Pi. Direwolf handles the AX.25 packet formation and also populates the frame with the APRS data. By itself it provides full functionality for creating an APRS station. It feeds the audio through a USB port to an audio device that’s connected to the speaker and mic connections on the radio since the Pi only supports audio output, not audio input. Some designs use a cheap USB audio device with mic and speaker ports, but that doesn’t provide the PTT functionality needed for the radio. That’s why we used the more costly SignalLink that uses an internal VOX to create a PTT signal on the mic plug, but cheaper options are available that we’ll be exploring later. (NOTE: the SignalLink was later replaced by a custom-designed component from Frank N3PUU).
Software
Direwolf conveniently will read APRS beacon text from either a text file or the output of a program, so we wrote a Python program that reformats the WX log file (which is copied from the WX Pi to the APRS Pi) into the format required by the APRS protocol. That translation took a while to get right, but it’s now working and the weather data is output in APRS beacons from W2MMD-13 that occur every 10 minutes. You can copy these beacons using an APRS-capable rig like a FTM-400 or FTx HT on 144.390. You can also see the beacons on aprs.fi – below are the web and iPhone visualizations from that site.
So far, so good – but we wanted more. Some of the metrics that we wanted to measure via APRS aren’t standard APRS weather measurements and don’t have a place in the weather protocol. For example, we want to measure the temperature inside the satellite room of the clubhouse since if the temps get much higher than 95 degrees we’ll need to find a way to cool those computers. This gave us an opportunity to explore another facet of APRS, which is the ability to send telemetry in an APRS packet. We formatted the clubhouse temperature along with the motion sensor reading and the lightning counter (the latter two aren’t yet functional) into the first three fields of a telemetry packet and set it up as a second beacon text, which is recognized as telemetry by Direwolf and aprs.fi. That seems to work OK, so we can now monitor the clubhouse temp from an HT or from the aprs.fi website. Pretty cool, eh?
Receiving telemetry
Initially the weather output from the station was available from two sources – the APRS beacons and the Skunkworks web page. The latter reporting was performed by a Python program that read the weather log file and wrote the graphs shown below. That worked well for a couple of years until we developed the more sophisticated reporting dashboard shown later in this article.
Next steps
After perusing the APRS specifications and the Direwolf documentation it’s evident that APRS is a powerful communication medium that we need to pursue. Our next project is to build an AC power sensor to notify if the clubhouse power goes out. The APRS Pi and radio run from a UPS so they’ll stay online for a short period (about 15 minutes) after a power failure, which would give time for a few APRS notification beacons. To do this we need to connect a 5 volt power source (a wall-wart power cube) to an analog to digital converter (ADC) and then to the APRS Pi, and write the Python software that will check the voltage (we only care if it’s zero or non-zero). This will let us measure the 5V line and change a telemetry field in the beacon text if the power is off. This can be picked up by the simple receiver and create a notification on the screen. Of course, if the power is off for an extended period the APRS transmissions will cease, but that could occur for several reasons other than a power failure so this will provide verification of the cause.
Follow up 3/2021
So after about a year of operation we found some ways to upgrade the dashboard used by the weather station. We discovered Grafana, a free dashboarding program that will accept inputs from many different data sources and allow building extremely easy and flexible dashboards. We first identified Grafana when it came packaged in a Docker container for monitoring the GOES satellite but quickly discovered its use for other purposes.
Although it can use multiple different data sources we found that the easiest for this purpose is a database program knowns as Influx, which is specifically designed for tracking time-series data (for you database nerds out there it indexes everything on a time-stamp that’s used as its primary key). All incoming data is automatically timestamped, even if the incoming data record doesn’t contain a time field, so we could simply write a weather record into an Influx database each time the program read the weather sensors and Influx would automatically timestamp it. Influx will automatically add to the database schema a new data field that it finds in the input, which means that adding new fields is simple. Influx is also free and easy to install on a Raspberry Pi.
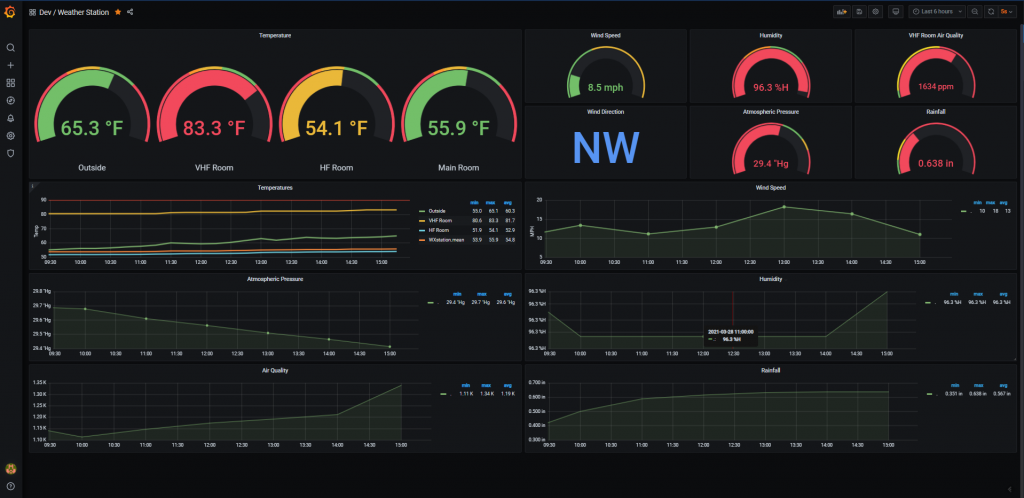
So we loaded Influx onto the weather station Pi and added a couple of lines of Python code to the weather program to write the weather values to the Influx database on each cycle. We then hooked up a Grafana dashboard to that database and started designing a much better weather dashboard as can be seen below. I did an initial draft of the dashboard and then Mike K2MRP who has far better design skills than I do took it over and make it much more readable and useful.
Monitoring Temperature Throughout the Clubhouse
The original weather station as described above has a temperature sensor attached to its mounting board that records the temperature inside the VHF room which is important because of the radios, computers, networking equipment and other equipment that runs in that room. Over the summer it’s important to keep that room’s temperature below the level that would cause damage to the equipment. Temperatures in other areas of the clubhouse are less important; however with the HF station and computer being powered up for remote use the temperature of the HF room may also be important to monitor. Mike K2MRP pointed this out, which gave us another project to complete.
We already had written weather station Python code for a Raspberry Pi so using another Pi with the same temperature sensor module created an easy path. Since we didn’t need significant computing power to read and report temperature once a minute I picked up a couple of Raspberry Pi Zero computers ($26 each) and BME280 temperature modules ($14 each). The Pi Zero is a smaller version of the Pi, takes less current and has wifi functionality so it could be located anywhere in the clubhouse and report temperature back to the Influx database in the weather station Pi. I wrote simple code to read the sensor and write its value to the database along with a room identifier each minute. Placing one sensor in the main clubhouse and the other in the HF room allows remotely monitoring the temperature of all of the rooms in the clubhouse.
 Save as PDF