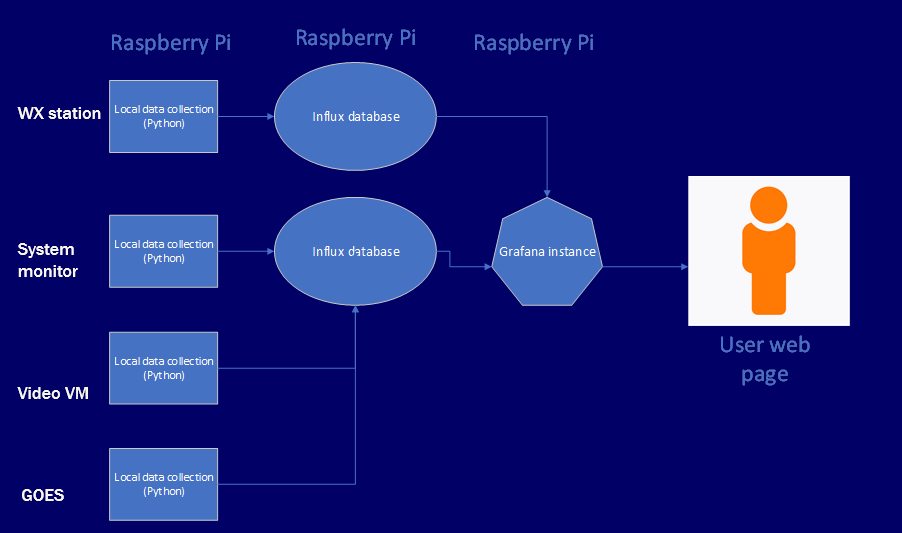
The Skunkworks projects at the GCARC clubhouse encompass about a dozen Raspberry Pi computers along with several Linux virtual machines running on the Skunkworks server. Monitoring all of these systems is a considerable task, so we developed a simple reporting structure that allowed multiple systems to be monitored easily on a Grafana dashboard backed up by Influx databases and some Python code.
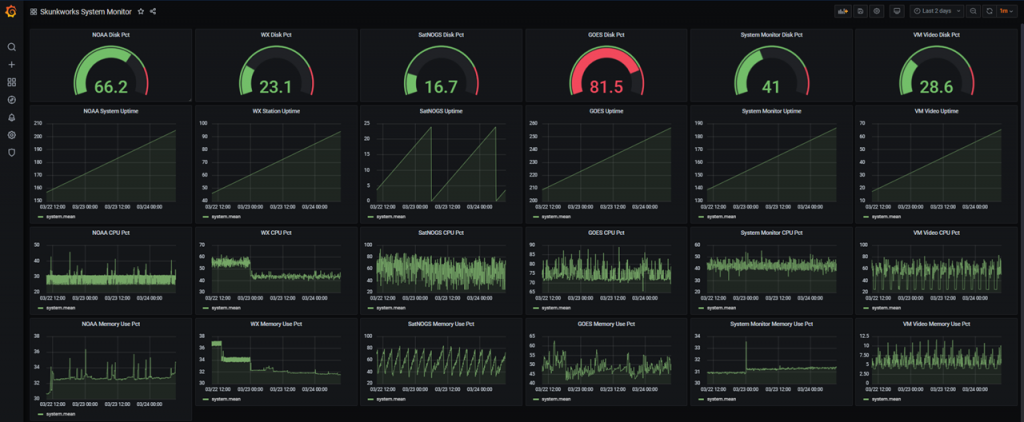
On each system a small Python program runs each minute using system calls to determine various operating characteristics (available disk space, CPU and memory usage, etc.) . Those programs write to a central database Influx on the system monitor Pi. A Grafana dashboard server runs on that Pi and serves up those metrics in an organized format,